Social wall analytics that prove your impact
Track post volume, sources, sentiment, and traffic in real time, then export the numbers your team needs to prove ROI


Why it works
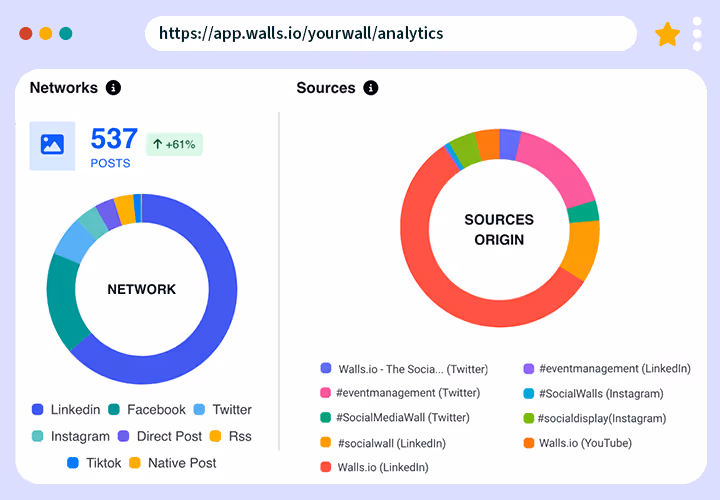
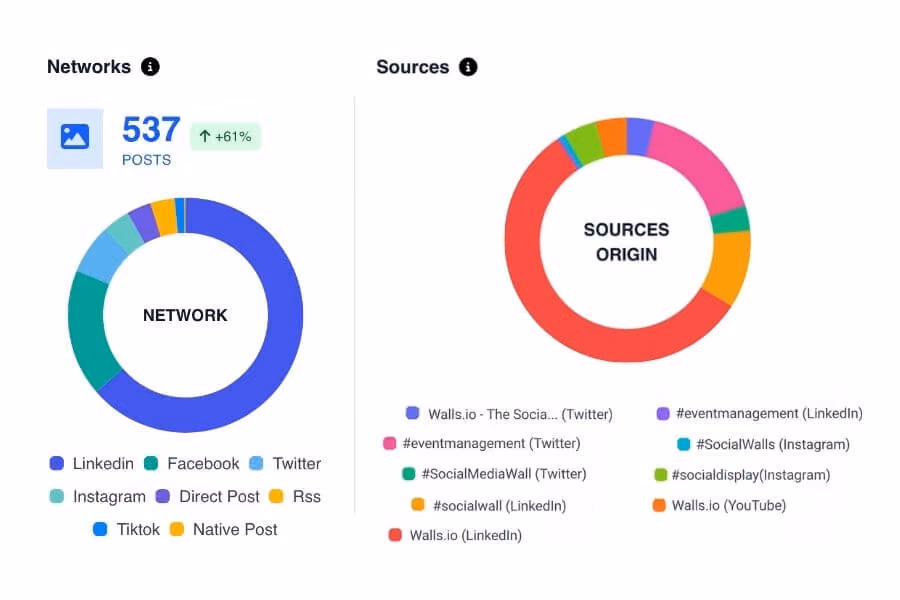
Your dashboard shows which sources drive the most posts, so you optimize your next campaign.
Track performance across events, launches, and everyday brand moments from one dashboard.
Pull data from your wall into your financial reporting and show what the wall delivered.
What it can do
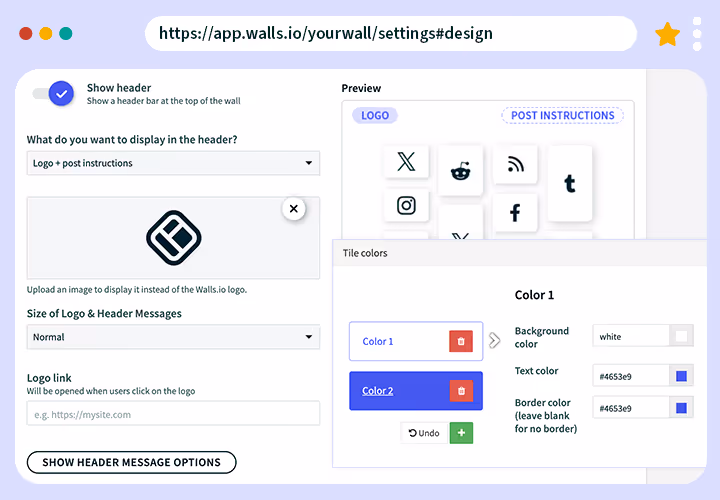
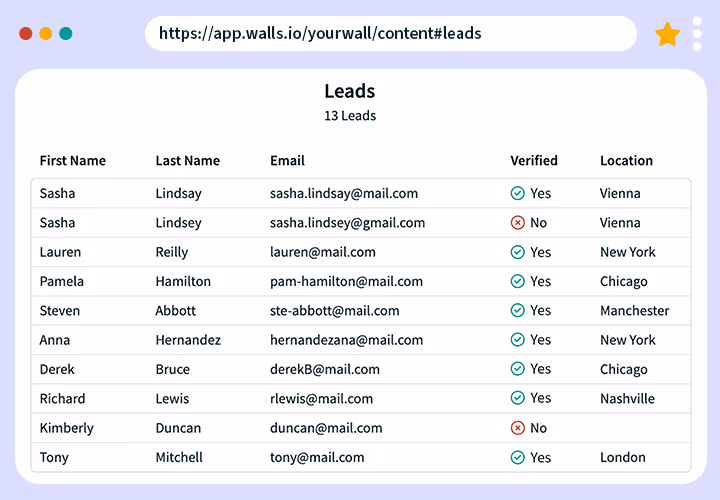
Detailed reporting
Walls.io separates network data from source-level detail, so you can see exactly which hashtags, accounts, and profiles are driving your feed.
Trend tracking
For all charts, our percentage indicator compares your current time frame with the previous matching period. You’ll be able to see shifts in performance and adjust campaigns as needed.
Flexible data visualization
Switch between line, bar, and area charts with one click. Build the view that fits how you, or your stakeholders, read data.

Audience overview
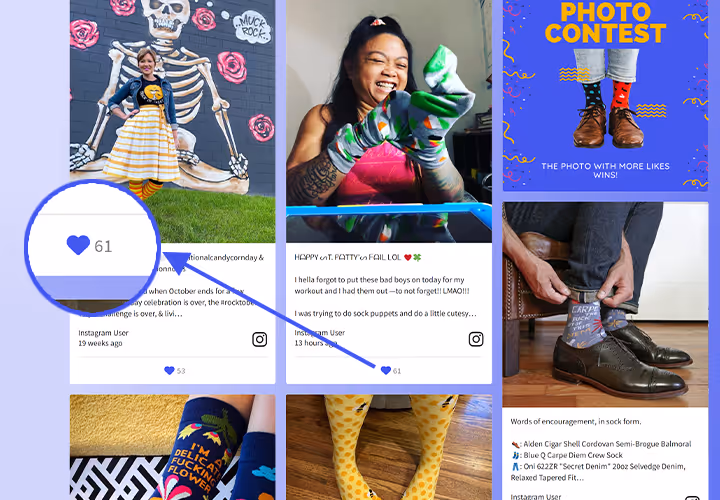
See where your wall's traffic comes from. This shows exactly where engagement is happening.

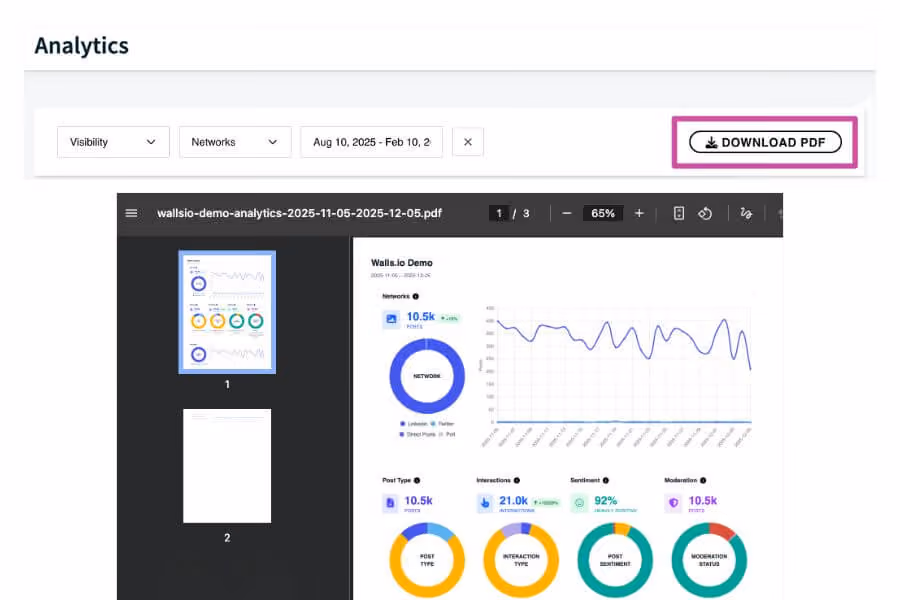
PDF export
In just one click, you can download all your charts and data into a polished PDF, ready to share with your team.
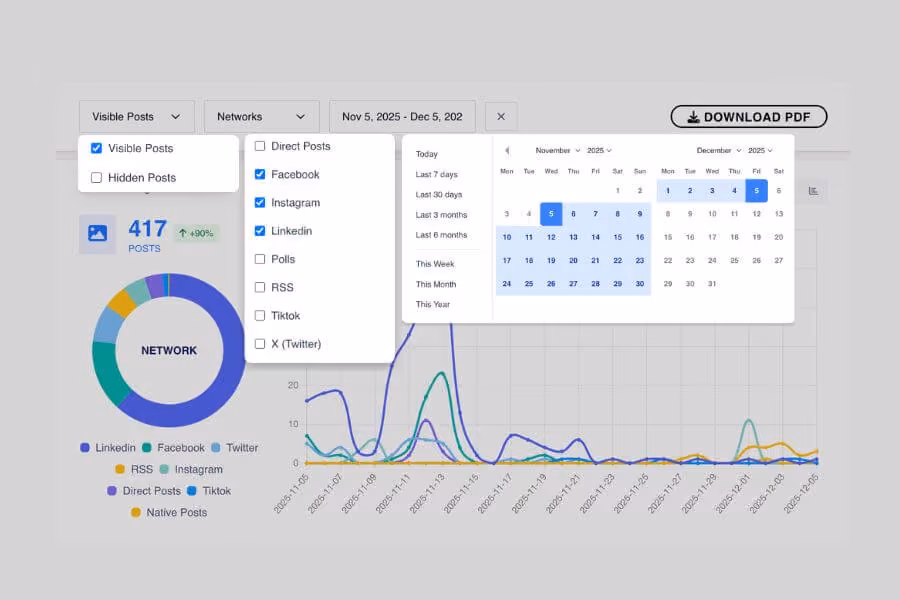
Quick filters
Narrow your dashboard by date, network, or post visibility, so you're only looking at the data that matters.
Trusted by teams worldwide
How it works
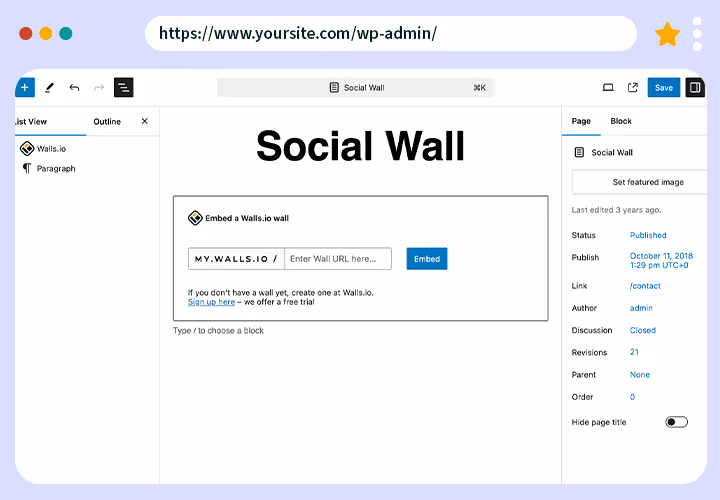
Set up your wall
Explore your data
Download your report
Share it with your team
Why choose Walls.io
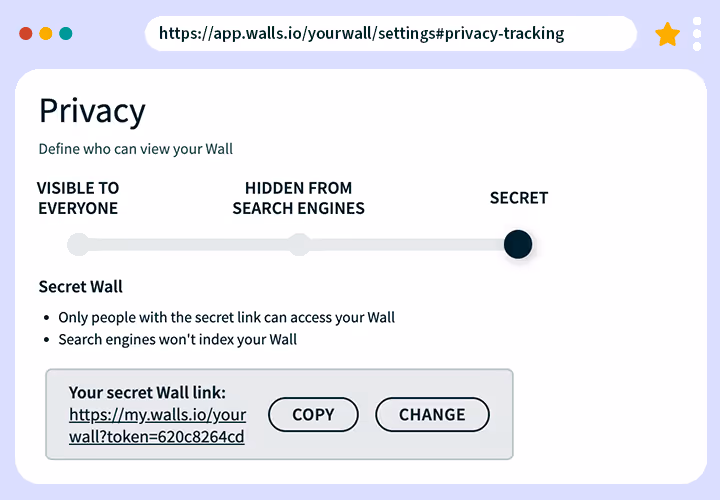
GDPR & CCPA compliant, and built with 2FA and cookie-free architecture from day one.
Walls are screen-reader friendly and meet WCAG standards, so every audience member can engage without barriers.
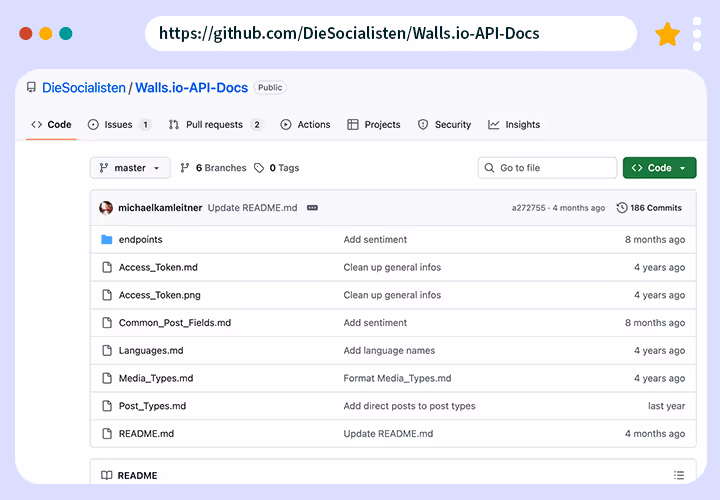
Connect to your existing tech stack via API, Zapier, and native integrations with complete control and advanced features.
One platform for events, websites, screens, and internal comms — no need to switch tools as your needs evolve — truly all in one social media in one platform.
Aggregate content from 14+ platforms, including X, Instagram, TikTok, LinkedIn, and YouTube , in a single live feed that unifies all your social feeds.
And we boast a full feature stack